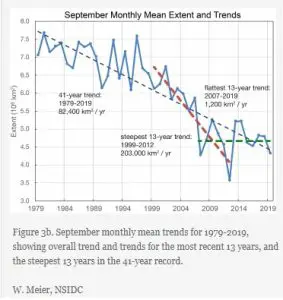
The graph here shows three different sea ice trends in the Arctic basin in September. The dashed blue shows the trend for the entire series, ie 1979-2019, the red shows the trend for the years with the steepest 13-year trend (1999-2012) and finally shows the green trend for the years with the flatest 13-year trend (2007 -2019). We will see how it will be next year, but you can still say that you should be careful in drawing conclusions based on variations year by year.
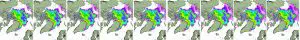
The growth of sea ice in the Arctic has been slow this autumn until just over a week ago. Above, I have posted what it has looked like between October 28 and November 5 (taken from Polarportal). As you can see, the icing can go very quickly under the right conditions.
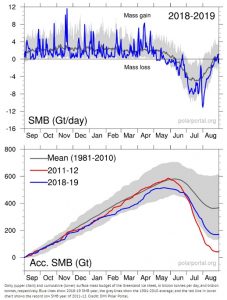
The summer meltdown in Greenland has been relatively large according to “How the Greenland ice sheet fared in 2019” published in Carbon Biref, although it is not a record.
In short, the fall and winter have been drier than normal, which has meant that a smaller amount of snow than normal has fallen on Greenland. On it, summer has been warm and also with some periods of great melting of the surface.
SMB (surface mass budget) is always positive at the end of the year, more snow falls on the ice than melts at the surface. Therefore, in order to achieve total melting, dynamic processes (calving), which on average between 1986 and 2018, have been 462 billion tonnes per year. This year, the analysis made indicates that it will end up with about 498 billion tonnes of ice, which has thus calved into the sea.
The total mass loss has been estimated at 329 billion tonnes, which is far more than the average of 260 billion tonnes but also far lower than in 2012, which landed at 458 billion tonnes. Here, too, of course it is unfortunate if you pull too large gears at a single year’s melting, which as you remember knowing that you did in 2012. 2017 and 2018, for example, the total mass loss was negligible, so you count the last three years together we still fall below the average . How you count and where you put the ruler depends largely on what message you want to get.

Leave a Reply